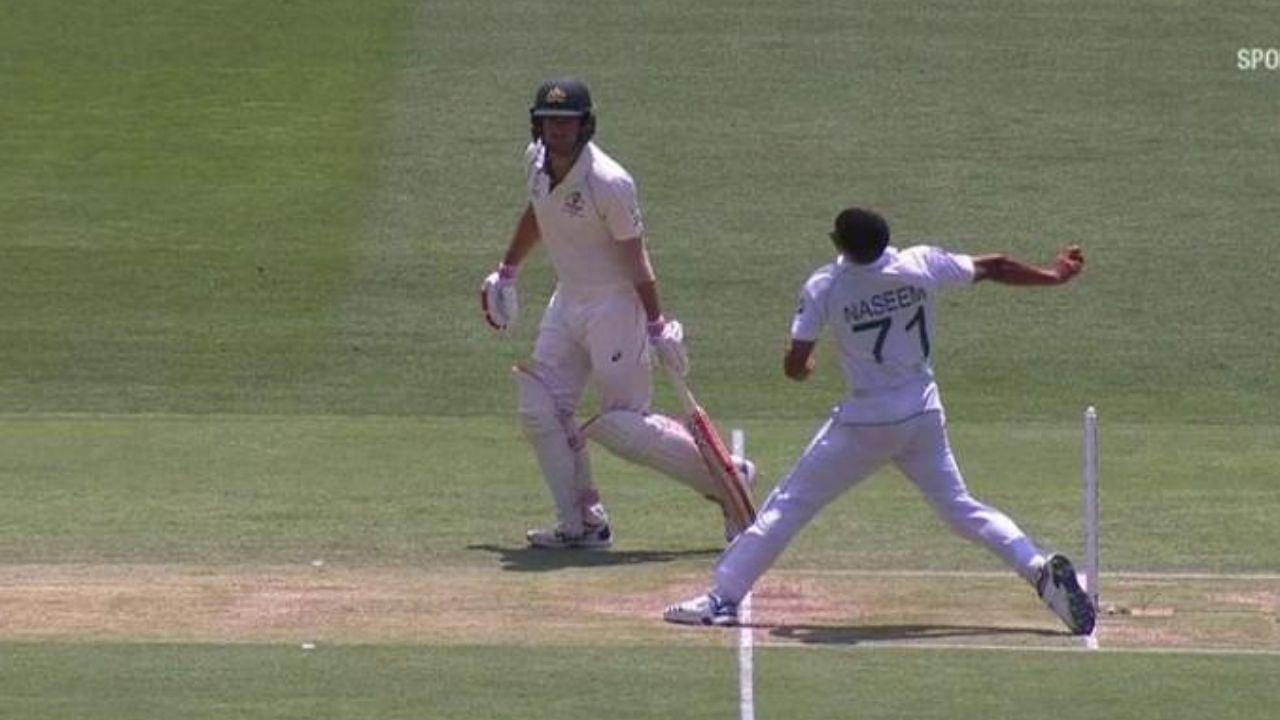
Most no balls in Test cricket: Number of no-balls bowled by bowlers in Test cricket have increased significantly this year.
Advertisement
During the fourth day of the first Test of the ongoing England’s tour of India in Chennai, a large number of no-balls are being bowled by bowlers to astonish one and all.
While fast bowlers tend to overstep across formats, the number mostly remains low in Test cricket. However, what has been beyond understanding in this Test is the fact that spinners have overstepped on more occasions than fast bowlers.
As compared to 20 no-balls in 190.1 overs in the first innings, Indian bowlers have now bowled another six no-balls in just 28 overs in the ongoing second innings. England, on the other hand, bowled a solitary no-ball in the 95.5 overs they bowled in the first innings.
In the ongoing Pakistan vs South Africa Test match in Rawalpindi, all the bowlers have bowled a total of 23 no-balls with around 45 overs still remaining in the match.
A primary reason behind a sudden surge in no-balls is the third-umpire calling them nowadays as compared to on-field umpires previously.
3 Test matches going on at the moment in which 29 no-balls have already been called – 11 Chennai, 10 Chattogram, 8 Rawalpindi. There is an increase since the TV umps started to call them. #PakvRSA pic.twitter.com/c3Lbgcb6mT
— Mazher Arshad (@MazherArshad) February 6, 2021
Most no balls in Test cricket
As far as the most no-balls in Test cricket are concerned, both the ongoing Test matches are still far away from registering an unwanted milestone either in an innings or in a complete match.
Most no-balls in an innings
| No balls | Overs | Team | Against | Ground | Year | NB per Over |
| 40 | 107.4 | England | West Indies | St. John’s | 1986 | 0.37 |
| 40 | 140.5 | Australia | West Indies | Adelaide | 1989 | 0.28 |
| 39 | 101.5 | Pakistan | Sri Lanka | Lahore | 2002 | 0.38 |
| 38 | 122 | Pakistan | West Indies | Georgetown | 1988 | 0.31 |
| 37 | 63 | Australia | West Indies | Perth | 1988 | 0.58 |
Most no-balls in a Test match
| No balls | Overs | Team | Against | Ground | Year | NB per Over |
| 103 | 395.2 | West Indies | Pakistan | Bridgetown | 1987 | 0.26 |
| 90 | 384.4 | Australia | West Indies | Perth | 1988 | 0.23 |
| 81 | 393.2 | West Indies | England | Bridgetown | 1994 | 0.2 |
| 79 | 425.1 | West Indies | England | Bridgetown | 1974 | 0.18 |
| 78 | 427.5 | West Indies | Australia | Bridgetown | 1999 | 0.18 |
For more cricket-related news, click here.


