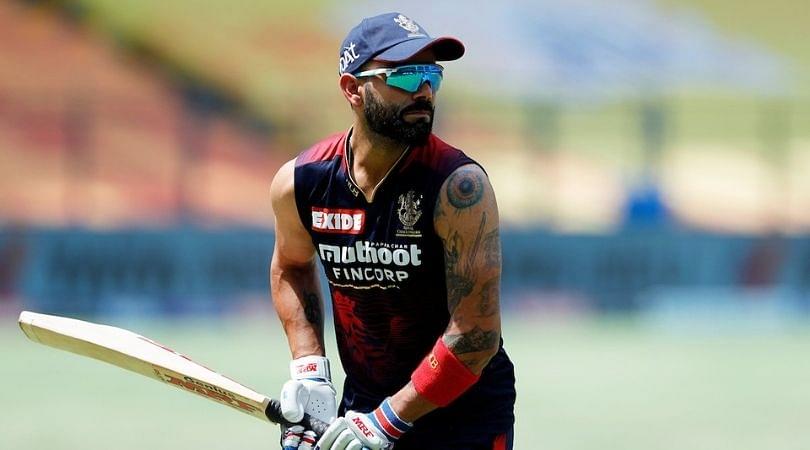
Virat Kohli all IPL season runs: The SportsRush brings you the list of Virat Kohli’s stats season after season from the inception of the IPL.
Advertisement
Royal Challengers Bangalore are just one win away from qualifying for the playoffs of the Indian Premier League 2022. The team has played great under the able captain of Faf du Plessis, but the form of their former captain Virat Kohli has been a huge concern for the side.
Virat Kohli, who left the captaincy of RCB from this season has been struggling to get into his groove with the bat. Kohli has not scored a single century in any format of the game since 2019 and has been far from his best in the Indian Premier League 2022.
Virat Kohli has been dismissed on a golden duck three times this season, and this explains the level of confidence in which Virat Kohli is in. Virat has just scored 216 runs this season at a dreadful average of 19.64, whereas his S/R has been 111.34. He has just scored a single half-century in the tournament.
Form is temporary, class is permanent. Well played Virat. #ViratKohli #RCBvGT #IPL2022
— Vinay Kumar R (@Vinay_Kumar_R) April 30, 2022
Virat Kohli all IPL season runs (Updated on 6 April 2023)
Virat Kohli is the highest run-scorer in the history of the Indian Premier League, and he was the first player to breach the mark of 6000 IPL runs. Virat has scored 6499 IPL runs at 36.31, with the help of five centuries and 43 half-centuries.
Virat Kohli’s worst IPL season was the 1st IPL season in 2008, where he managed to score 165 runs in 13 innings at an average of 15.00. Despite a poor IPL 2022, he has already crossed the hurdle of his worst IPL season.
In 2016, Virat Kohli was at his smashing best, where he proved his immense consistency with the bat. He scored 973 runs in IPL 2016 at an average of 81.08, courtesy of seven half-centuries and four centuries. No batter in the history of the IPL has been able to match the stats of Virat Kohli’s 2016 season.
Virat Kohli is the only player in the history of the IPL who has played all the seasons for just a single team.
| Year | Matches | Runs | HS | Average | Strike Rate | 100 | 50 |
| 2023 | 2 | 103 | 82* | 103.00 | 153.73 | 0 | 1 |
| 2022 | 16 | 341 | 73 | 22.73 | 115.99 | 0 | 2 |
| 2021 | 15 | 405 | 72* | 28.92 | 119.46 | 0 | 3 |
| 2020 | 15 | 466 | 90* | 42.36 | 121.35 | 0 | 3 |
| 2019 | 14 | 464 | 100 | 33.14 | 141.46 | 1 | 2 |
| 2018 | 14 | 530 | 92* | 48.18 | 139.10 | 0 | 4 |
| 2017 | 10 | 308 | 64 | 30.80 | 122.22 | 0 | 4 |
| 2016 | 16 | 973 | 113 | 81.08 | 152.03 | 4 | 7 |
| 2015 | 16 | 505 | 82* | 45.90 | 130.82 | 0 | 3 |
| 2014 | 14 | 359 | 73 | 27.61 | 122.10 | 0 | 2 |
| 2013 | 16 | 634 | 99 | 45.28 | 138.73 | 0 | 6 |
| 2012 | 16 | 364 | 73* | 28.00 | 111.65 | 0 | 2 |
| 2011 | 16 | 557 | 71 | 46.41 | 121.08 | 0 | 4 |
| 2010 | 16 | 307 | 58 | 27.90 | 144.81 | 0 | 1 |
| 2009 | 16 | 246 | 50 | 22.36 | 112.32 | 0 | 1 |
| 2008 | 13 | 165 | 38 | 15.00 | 105.09 | 0 | 0 |

