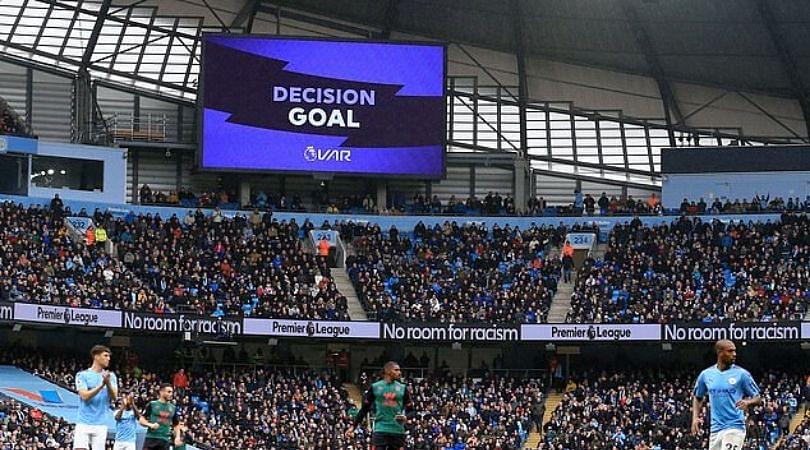
Premier League table without the interference of VAR decision has appeared on the internet and it shows how the season would have been different.
The video assistant referee made its debut in the Premier League this season and has been amid controversies ever since there have been many decisions which have made the fans furious and question its implementation.
Moreover, it has certainly altered the outcome of many results, most of the times. Be it the offside rule or penalty decisions, VAR has not spared anyone even over fine margins.
Despite, in an attempt to make the correct decisions, VAR has made some errors in an attempt to reach perfection. Most of the managers in the Premier league certainly want a change in the implementation of the technology to increase the efficiency of the technology.
If VAR has been able to change several results in the league, then it is obvious that the current table under the non-VAR procedures would have been very different.
To answer our query, a table has surfaced online which explains how the Premier League would have been different if the involvement of the technology had not been there.
To our surprise, the table does not bring much difference to the current table, as Liverpool would have been winning the league with a drastic difference Watford, Norwich City and Southampton would still have been in the relegation zone.
Also read: Arsenal Fan TV soared on frustration after Arsenal 2-2 draw against Southampton
Search #LiVARpool if you want a chuckle at some "VAR handing Liverpool the PL" conspiracy theorists.
Just a reminder… here's what the league table looked like without VAR before this weekend… pic.twitter.com/AknMEh6DAa
— Will Gavin (@WillGav) November 23, 2019
1. Liverpool – 34 points
Actual position – 1
2. Man City – 30 points
Actual position – 3
3. Chelsea – 27 points
Actual position – 34
4. Leicester – 23 points
Actual position – 2
5. Sheffield United – 20 points
Actual position – 8
6. Wolves – 20 points
Actual position – 5
7. Arsenal – 18 points
Actual position – 7
8. Man United – 17 points
Actual position – 10
9. Bournemouth – 15 points
Actual position – 11
10. Burnley – 15 points
Actual position – 6
11. Brighton – 15 points
Actual position – 12
12. Everton – 15 points
Actual position – 15
13. West Ham – 15 points
Actual position – 16
14. Newcastle – 15 points
Actual position – 14
15. Aston Villa – 13 points
Actual position – 17
16. Tottenham – 12 points
Actual position – 9
17. Crystal Palace – 12 points
Actual position – 13
18. Watford – 8 points
Actual position – 20
19. Norwich – 7 points
Actual position – 18
20. Southampton – 5 points
Actual position – 19
(Some changes have been made in the text of the table as it was released before Manchester City Vs Chelsea match).


